|
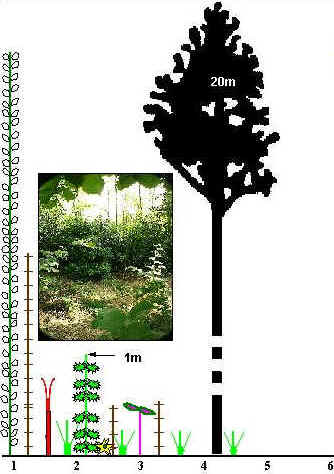
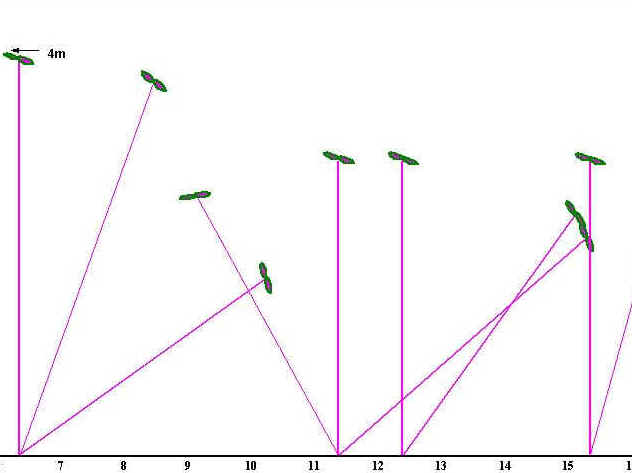
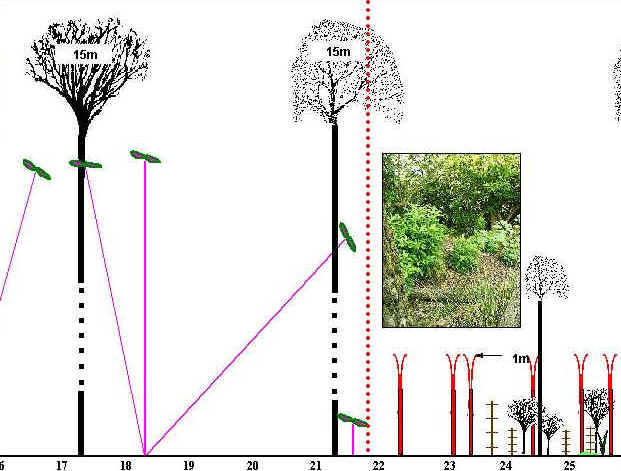
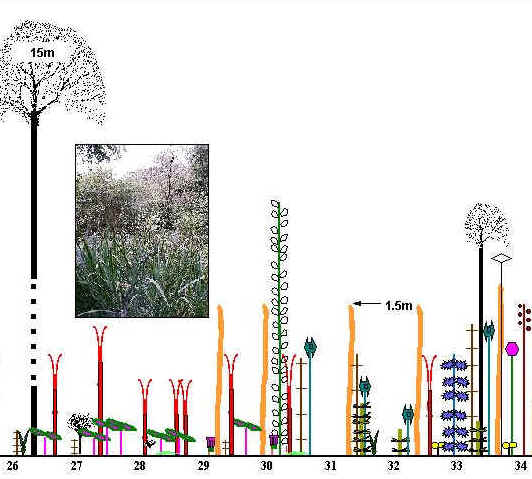
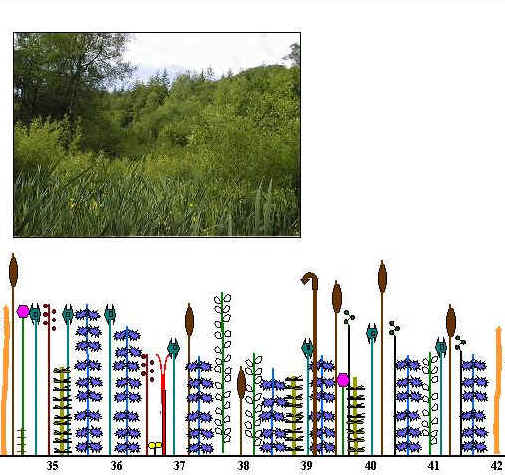
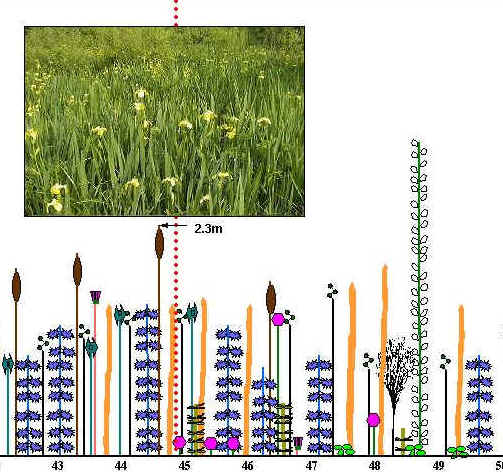
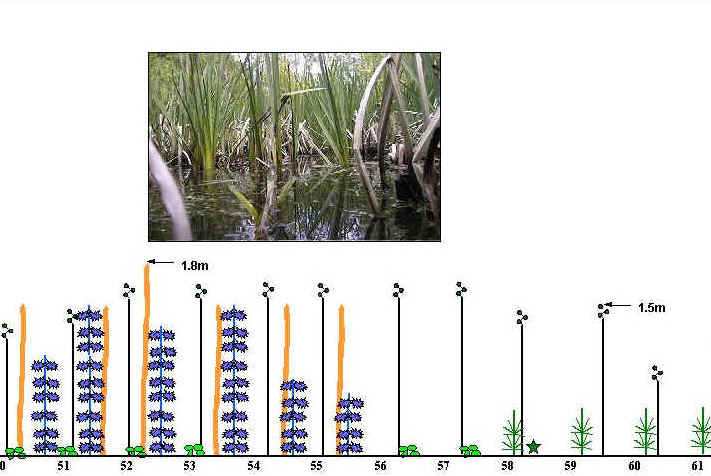
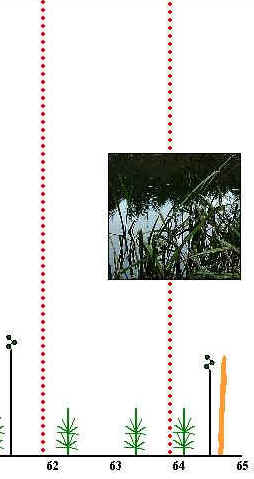
The diagram below illustrates all the plants which touched the transect line. Click here for an overview of the transect position in the Wetland. This transect is marked by the red line on the photograph. The plants are diagrammatically represented In the illustration below. The horizontal scale is in metres. Click here for the Key to Species. The water levels are illustrated at the bottom of the diagram. Blue indicates standing water, marked with the approximate depth. Areas without standing water are indicated by the colour olive. Where the areas are adjacent there is a gradient between them. Marked water levels are not absolute, but will fluctuate according to the amount of water entering the wetland. Photographs have been used to give a general idea of the vegetation at particular points. The photographs were not necessarily taken at exactly the same time of the survey. Therefore certain species, although present, may not be conspicuous. Maximise your screen now to view this diagram.
Windows users can press the F11 key to alternate between full screen and normal. |
|
||||||||||||
 |
 |
 |
 |
 |
 |
 |
 |
|||||
|
||||||||||||||||||||||||
| North | South | |||||||||||||||||||||||
The diagram above clearly shows the plant zonation pattern across the wetland. At the northern-most end of the transect, species which prefer drier land predominate. This includes species such as Nettles, Brambles, Rhododendron, Silver Birch and Scots Pine. The Rhododendron which used to dominate this area prior to restoration (Historical Background) still dominates this marginal dry land zone (6-21m mark). The marsh area adjoining the dry land zone prevents the Rhododendron from encroaching further, but it is easy to see that if the wetland were allowed to silt up to any extent, the Rhododendron would once more rapidly cover the area. The trunks of Rhododendron can stretch virtually horizontally, above ground level, for many metres. It is therefore possible for the roots and main trunk of the plant to be on acceptably dry land, while the rest of the plant canopy reaches well out into adjacent marshy areas. This means Rhododendron plants are capable of extending their zone of dominance well beyond suitable ground conditions. The dry land zone grades into the marsh area beyond the Rhododendron (22metre mark). The marsh zone is characterised by water-logged sediments and levels of standing water which vary with the topography of the zone. Dips and hollows fill with water, while higher mounds are dry. It must be stressed that the water levels marked on the diagram above were correct at the time of the survey. However, they will fluctuate according to the amount of rainfall and stream water which is entering the wetland. The marsh area closest to the dry land zone (22m-30m) has many small Rhododendron and Silver Birch seedlings. The area is too wet for them to compete successfully here. Soft Rush is also common in this region. Further into the marsh area (approximately 31m - 46m), species such as Yellow Iris, Water Mint, Marsh Bedstraw, Willow, Wood Clubrush, Branched Bur-reed and Reedmace predominate. As the water becomes deeper, most of these species begin to die out, leaving Yellow Iris, small Water Mint plants and Branched Bur-reed to dominate. With increasing water depth, only the Branched Bur-reed is left from the marsh flora (56m mark) and open water species such as Duckweed and Canadian Pondweed begin to occur. These are the main species to be found in the open water zone. The continuous line transect is valuable in that it does pick up most of the species present in the transect area (29 species in this case). However, the great number of plants which have to be diagrammatically represented along the line makes the illustration quite difficult to look at and extract information from. There is a great deal of 'clutter' taking the eye away from general patterns of distribution. In contrast, the interrupted line transect (Transect Diagram) where records were taken every metre very clearly shows the patterns of plant zonation. This is because a lot of the less dominant species have been removed from the picture. The disadvantage with this line transect is that it is likely to underestimate the range of each species. This is the total region through which the species can be found. As records are only being taken at every metre mark, plants will only be recorded if they happen to touch the line at the right point. The range of a number of the more important plant species distributed along the North/South line transect is shown here. This diagram was derived from the continuous line transect data, for the reason noted just previously. Why use line transects? - the merits of different types of line transect.
|
||