Offwell Wetland Survey
List of Diagrams, Charts and
Tables
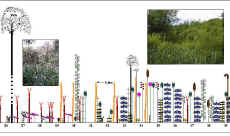 |
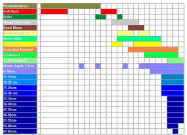
Line Transect Diagrams Continuous line transect diagrams depicting symbols of each plant species to touch the line along its entire length, together with water depth data. Interrupted line transect diagrams showing plants touching the line every metre. Interrupted line transect diagrams showing plants touching the line every other metre. |
|
Key for Line Transect Diagrams Key to the Species shown on the Line Transect Diagrams. |
|
Plant Zonation Diagrams |
|
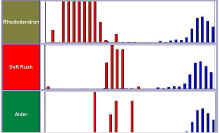
Species Distribution Bar Charts |
|
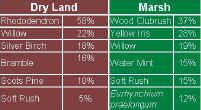
Table showing the six most dominant species in the Wetland |
|
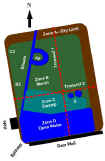
A diagram of the Wetlands showing the transects and key areas |
|