Offwell Wetland Survey
Survey Details
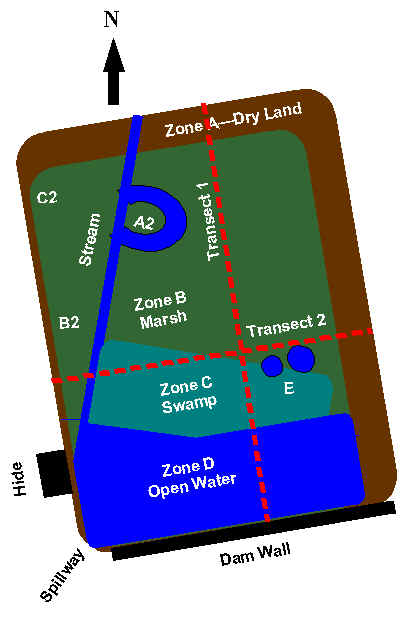
The Wetland Project Survey was carried out in September 2000. It involved first of all mapping the area and defining different sub-regions within the wetland. The results of this are outlined in the interactive diagram below. Click on the individual zones shown in the diagram to go to pages of images and descriptions of each sub-region. There are also plant species lists individual to each particular location in the wetland. The second part of the survey consisted of carrying out two transects through the wetland, one running from North to South (Transect 1) and the other from East to West (Transect 2). Each transect started on dry land and passed through marsh, swamp and open water in succession. In each case, both line and belt transects were carried out in order to illustrate the difference in the type of data obtained. To access this data, click on the Transect Lines shown in the interactive diagram. Diagram of the Wetland The diagram below is interactive. Click on the zone text titles to go to a page describing the zone, together with a plant species list specific to that zone. For a map showing the position of the wetland within the Woodland Education Centre at Offwell, click here. |
 |
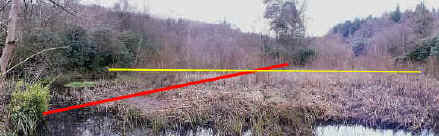
The Wetland in winter, looking North from the dam wall |
|
|