 |
The Woodland
Education Centre |
|
|
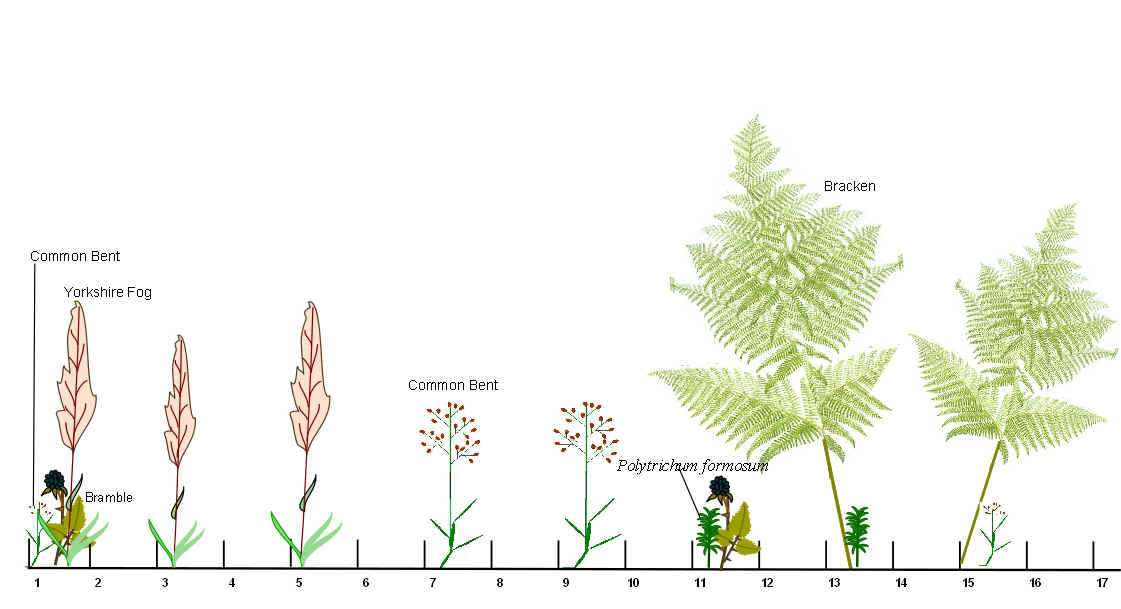
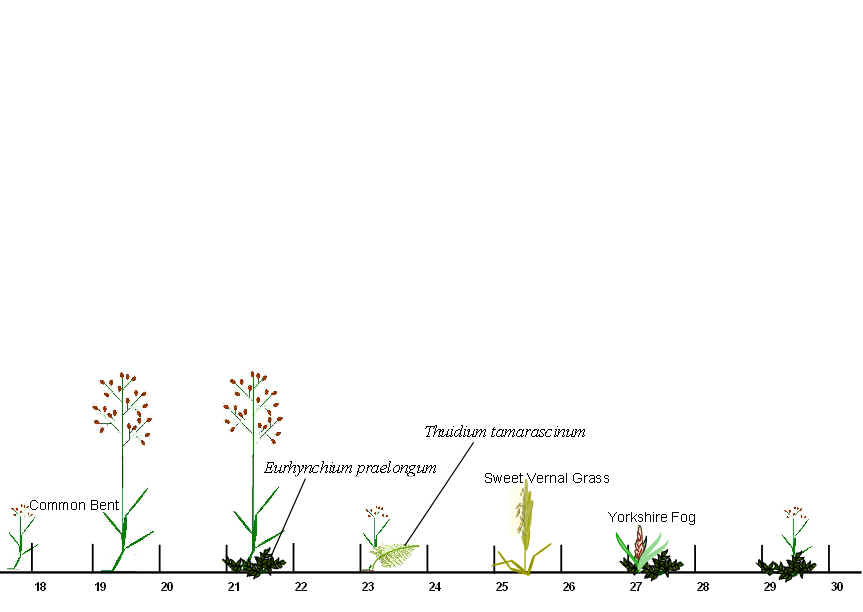
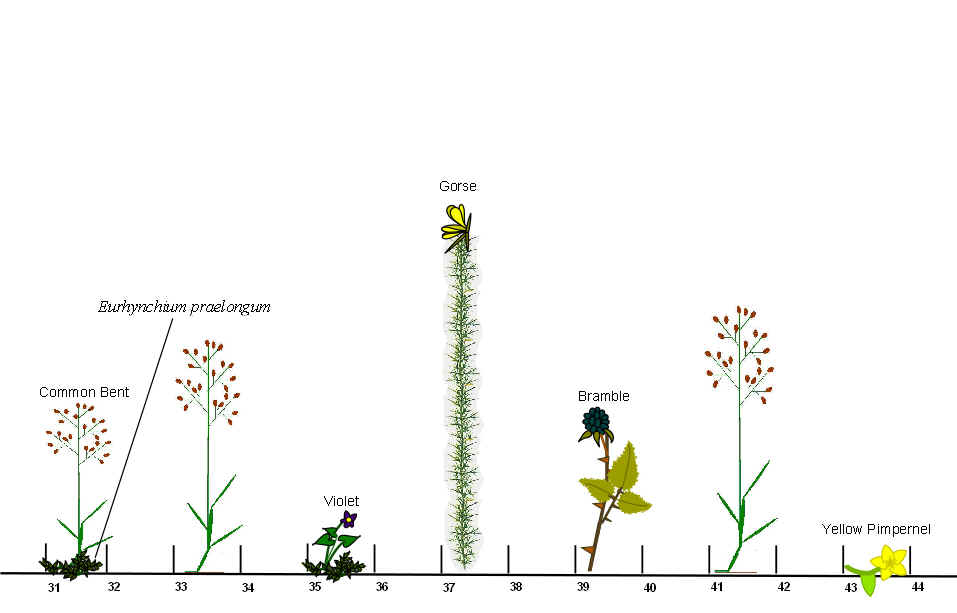
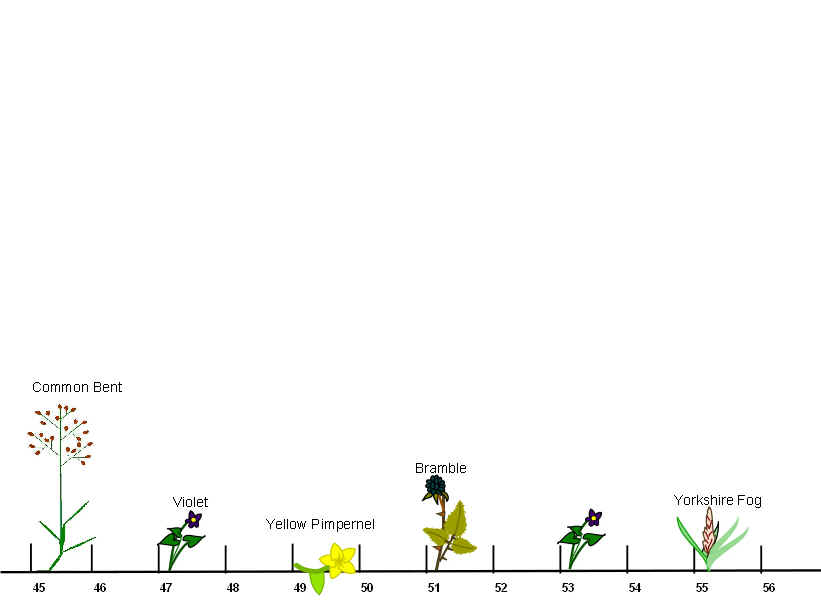
Transect Diagram July 2001 |
|||
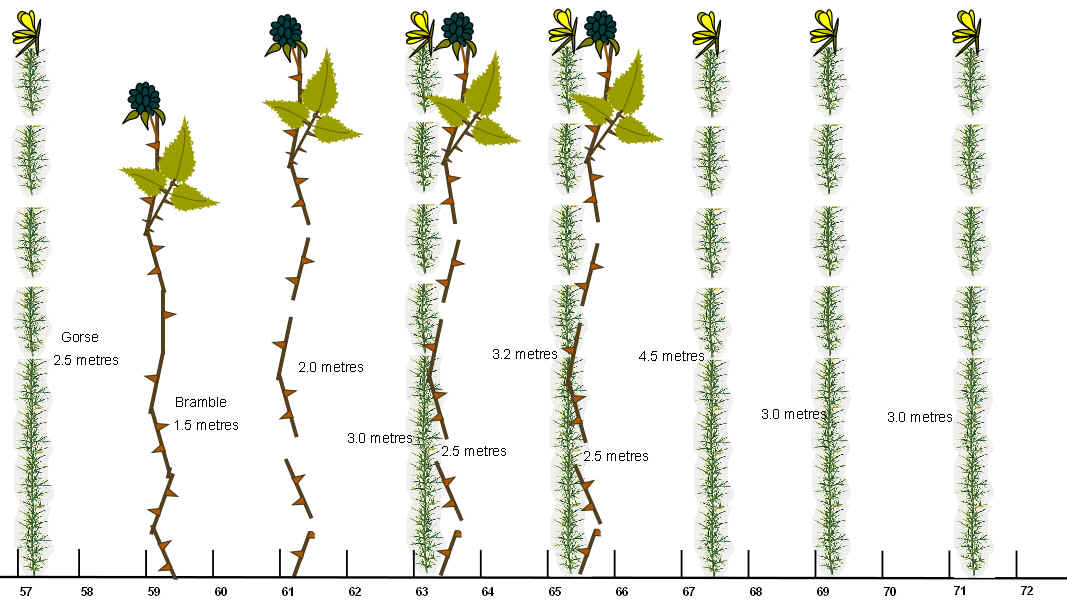
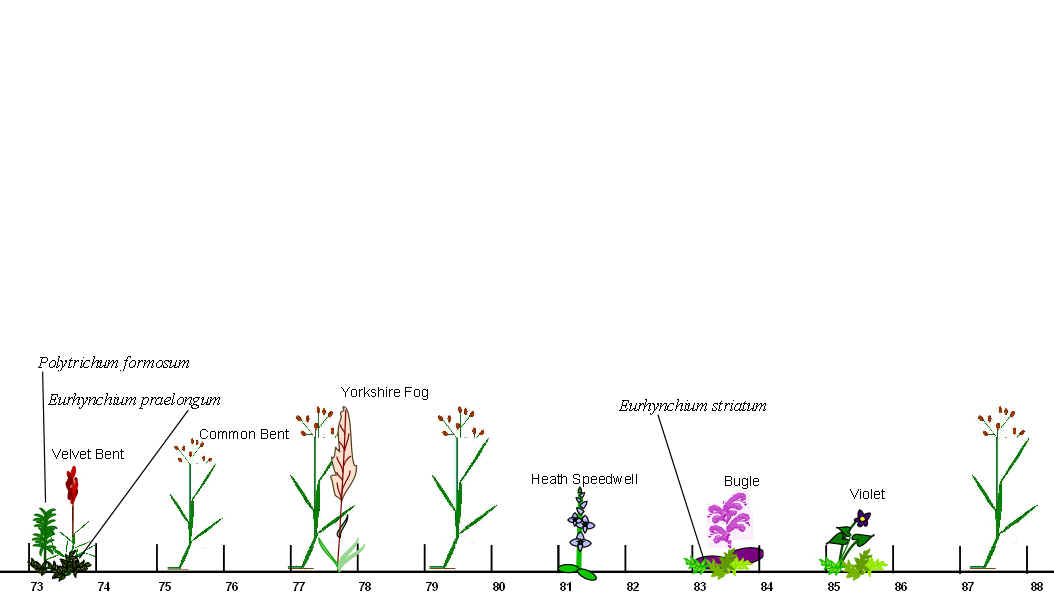
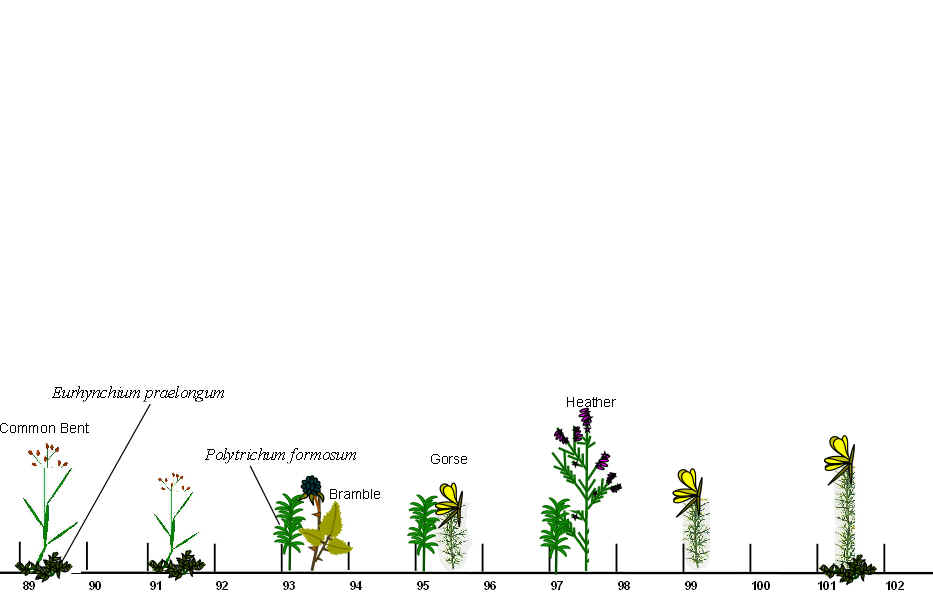
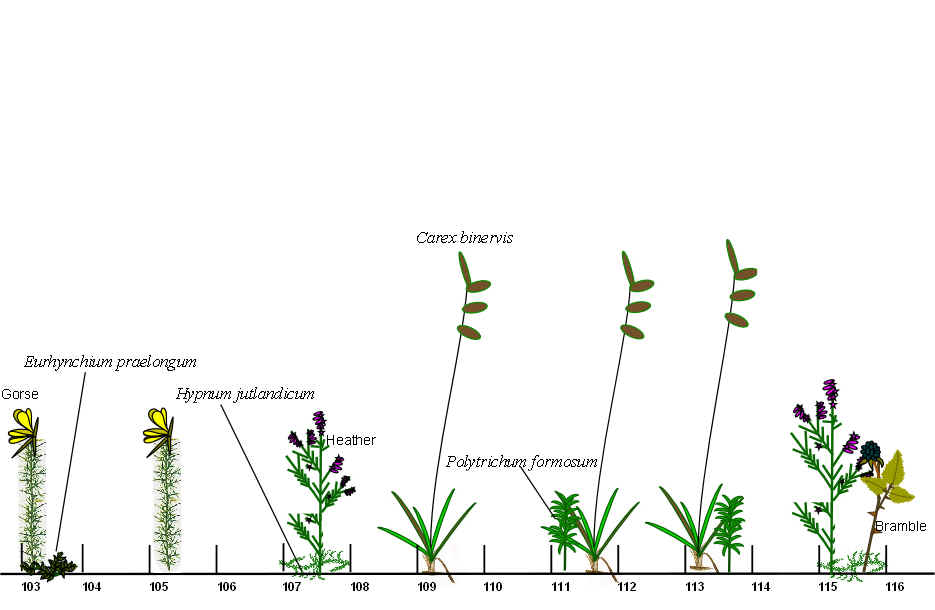
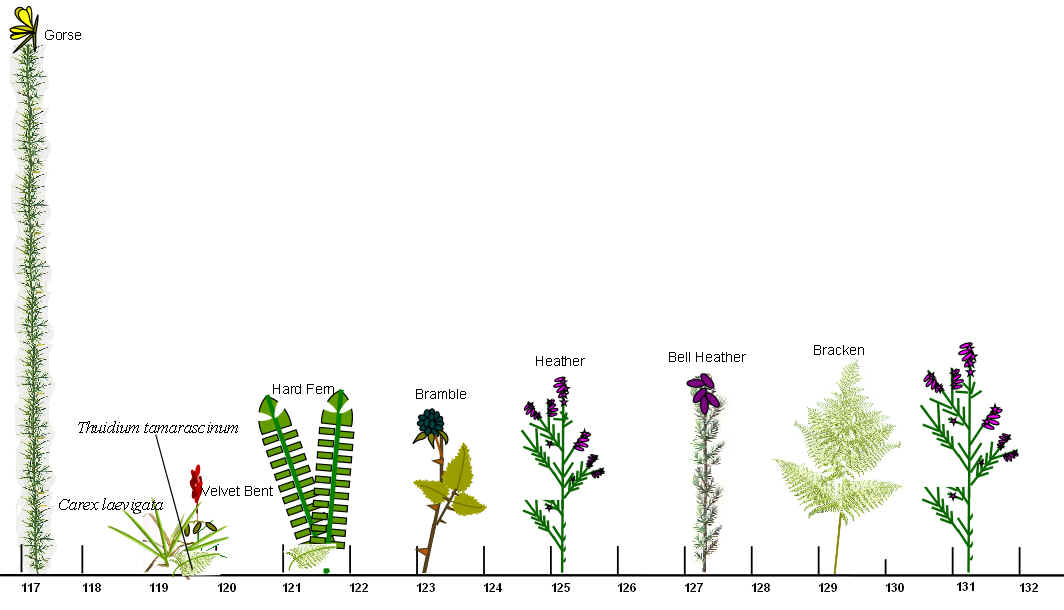
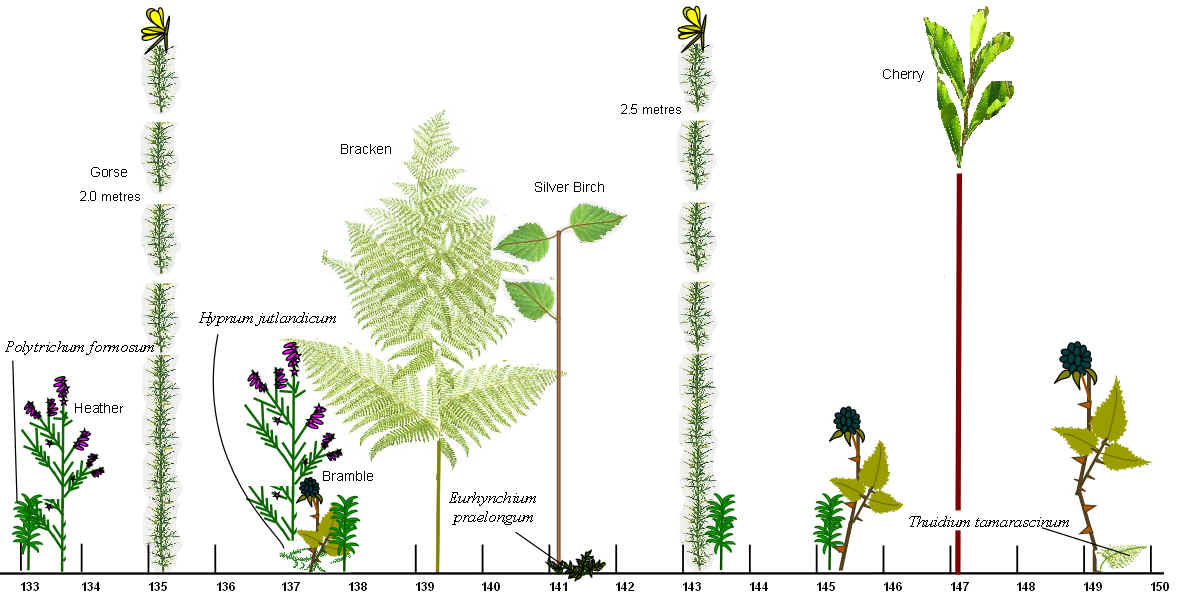
The transect diagram shows the dominant plant species (% cover) in each quadrat along the heathland belt transect. Quadrats of 0.5 m2 were recorded every 2 metres along the transect line. Where a moss was the dominant species in a quadrat, the dominant flowering plant(s) have also been included to give a better visual representation of the quadrat. The heights of the plants are to scale, except for the mosses, many of which are very small and some of the plants in section 5 which were too tall to fit into a scale suitable for the rest of the transect. Where a plant is not drawn to scale, the stem is represented by a dashed line and the actual height of the plants is indicated alongside. The heights represented in the transect are the maximum height attained by the dominant species within each quadrat. The numbers along the bottom represent metres along the transect line. Scale: 1cm = 10cms |
|||