Offwell Wetland Survey
Changes in the Percentage
Cover of Individual Species
along the East/West Belt Transect. (Continued )
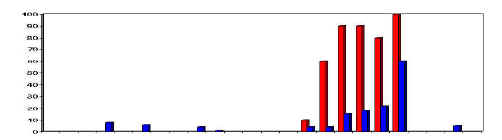
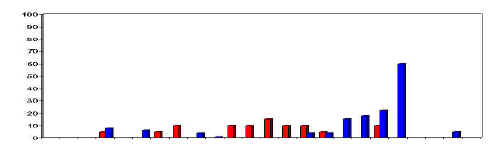
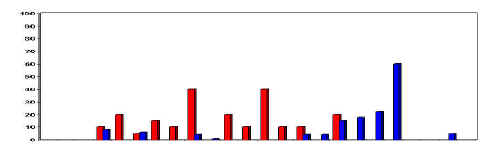
The bar charts below illustrate the distribution of individual plant species along the East/West Belt Transect. The red bars represent the % cover of the plant species in each 1m quadrat along the line. This shows where each species occurred on the line, as well as how much of it there was at each point. The vertical scale is the same for each bar chart. The blue bars in the charts represent the water depth, with maximum depth being 65cm. These bar charts can be directly related to the plant zonation diagrams produced as part of the line transect results. The species colours are co-ordinated between the diagrams and these charts. Comparison of the two illustrates the difference in the type of results obtained using line and belt transect methods. Most species will have an optimum zone within their range where the environmental conditions are best suited to their growth. In the diagrams below, this zone will be indicated by the area where the species reaches its maximum % cover. The percentage cover will often tail off gradually to either side of the optimum zone. The optimum zone for Bog Bean is clearly in the deepest water areas. Reedmace and Branched Bur-reed both occupy a wide range across the centre of the transect where the water levels vary, but are fairly shallow. Branched Bur-reed is more dominant (the red bars are taller). Silver Birch and Alder are found in the drier areas on either side of the transect, while Willow also extends into the wetter marsh areas.
|
| East | West |
|
| Willow | 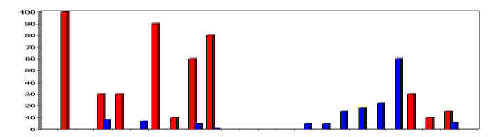 |
|
| Bog Bean |
|
|
| Alder | 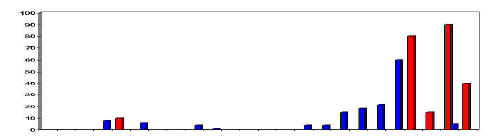 |
|
| Reedmace |
|
|
| Branched Bur-reed |
|
|
| Silver Birch | 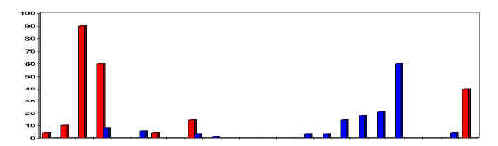 |
|
Plant Zonation diagram for the East/West Transect