|
The
Woodland Education Centre |
|
|
The
Woodland Education Centre |
|
Ecological Surveys 1996 - 1998
Species similarity between Sections
| In 1997, all the
sections were quite dissimilar in terms of the species present in them. This is a
reflection of the extremely varied seed bank regenerating on the site. By 1998, the
sections had many more species in common (although the amount of each species in a
particular section varied considerably). The increasing species similarity between sections resulted from the disappearance of species not suited to current conditions on the site, and the spread of those favoured by current conditions. Current conditions are the result of both prevailing weather conditions and the management regime. |
 |
 |
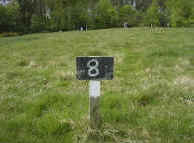 |
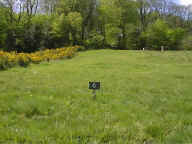
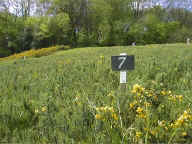
Views of strips 6, 7 and 8 on the Heathland Restoration site.
The degree of similarity between the vegetation
of different sections can be examined by a comparison of indices of similarity, calculated
for paired sections (table below).
|
The index of similarity between two sections was calculated using the following formula: Index of Similarity = 2C B = the number of species in section B C = the number of species common to both sections The closer the index of similarity is to 1, the more similar the sections are. 1996 data was not analysed because many of the species present in 1996 were only identified to genus level. The results would thus not be truly comparable to those obtained in 1997 and 1998. Species numbers obtained from the random data were used to calculate the indices for 1997 and 1998 (Table above). This was done because the belt transect data routinely underestimates the number of species present due to the smaller number of samples taken and the narrow band actually sampled (more here). Comparisons of the indices of similarity for paired sections reveals a number of general insights.
|
Continue to the effects of management ![]()
Ecological Surveys 96 - 98 |