|
The Woodland Education Centre |
|
|
The Woodland Education Centre |
|
Ecological Survey Methods
| Two different methods have been used to survey the vegetation on the
Heathland Restoration Project site over the period 1996 -2001. A belt transect has been
carried out every year. Random quadrats were also sampled from 1997 onwards. The results obtained using the two different methods were in many cases quite different from each other. (This illustrates the need to use the same method of sampling when comparing results from different areas or over time.) The random quadrat data were judged to be the most accurate. However, the two sets of data taken together provide a good overall picture of vegetation on the site. |
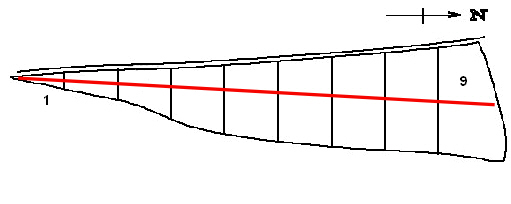 |
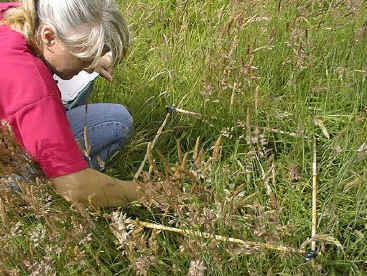
In July 1996, the site was surveyed by stretching a transect line (a rope marked at 1m intervals) across the centre of the site, from the southern boundary of section 1 across to the northern boundary of section 9. |
| A 0.5 m2 quadrat
(a square frame measuring 0.5m on each side) was placed on the ground every 2m along the
line. The plant species inside the quadrat were identified, their % cover was estimated
and their maximum height noted. This type of survey is called a belt transect, because it measures species abundance across a narrow band (similar to a belt). In addition to the belt transect, a general survey was also carried out to note other plant species occurring outside the transect area. Progress of the Heathland Restoration Project has been monitored on an annual basis since this initial survey was carried out. The survey in 1996 was based solely on the belt transect method. Subsequent surveys have incorporated random sampling, as well as a belt transect. The belt transect position was not permanently fixed, although it was carried out in virtually the same area each year. Random quadrats were included from 1997 onwards because it was felt that the belt transect only covered a very narrow band across the centre of the site. While this allowed comparisons to be made between the vegetation of different sections, it did not necessarily accurately reflect the overall plant cover of the sections.
For the belt transect method, quadrats were surveyed every other metre along the line in each section. An equivalent number of random quadrats were sampled in the top of each section. This was repeated for the bottom section of each strip. As a result, twice the number of random samples were taken in each strip overall compared to the belt transect. The two sets of results together cover all areas of the heathland site and give a good picture of alterations in the vegetation cover of the site over time. Annual surveys were carried out in the same month each year (July) to avoid introducing sampling errors caused by seasonal changes in vegetation. For example, if the project site was surveyed in May when Bluebells and wood-rushes are at their peak in growth and flowering, these species would show as being far more dominant on site than the July surveys indicate. By the time July arrives, both Bluebells and wood-rushes have substantially died back, greatly reducing their percentage cover in sampled quadrats. Other species have then taken over the dominant role for the time being. A second annual survey, this time carried out in July of the following year, would then apparently show that Bluebells and wood-rushes had substantially decreased on the project site over the intervening year. This would clearly be an erroneous conclusion brought about by comparing data which was not comparable. There will inevitably be seasonal differences in the dominant species in each project strip, therefore it was important to make sure that the surveys were carried out at the same time each year to allow meaningful comparisons to be made. July was chosen because this is the peak time of year for most plant species to be flowering. This greatly aids identification of species, particularly grasses. Additional Notes
Sample of Raw Data Comparison of Sampling Method Results
|
Continue to >> Plant Species List
Ecological Surveys 96 - 98 |