|
The Woodland Education Centre |
|
|
The Woodland Education Centre |
|
Ecological Survey 2001
Changes in Moss
Abundance
2000 - 2001
Eurhynchium praelongum |
|
| Thuidium tamarascinum |
|
Polytrichum formosum |
|
Hypnum jutlandicum |
|
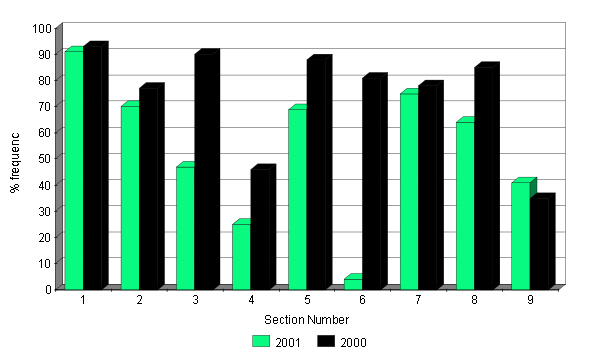
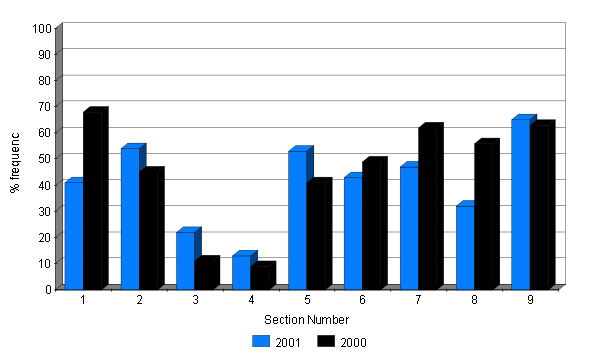
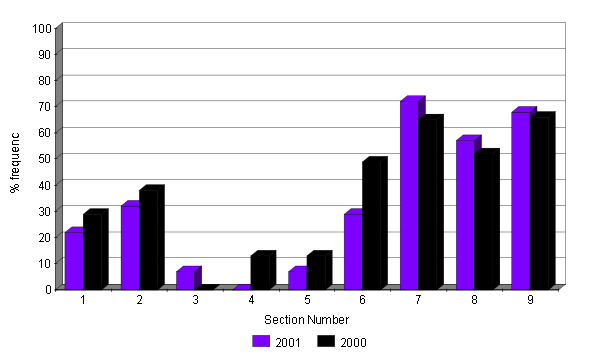
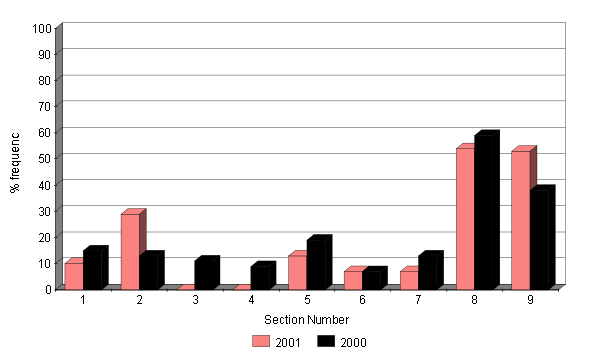
| The
comparisons between sections have been made using % frequency (with data taken from
all the quadrats sampled, both belt and random) as a measure of abundance. Percentage frequency = the percentage of the total number of quadrats sampled which contained the species. For example, a percentage frequency of 100%, means that the species was found in all quadrats sampled. Percentage frequency has been used as a measure of abundance rather than mean % cover, because in many cases, changes in moss mean % cover were relatively small from one year to the next. This disguised the fact that many of the mosses had greatly increased in extent across the site over the year. This is demonstrated by the fact that they were found in a much higher percentage of the quadrats sampled. The % frequencies shown above are based on an average of 25 quadrats sampled per section. Differences of 10% frequency (which equates to a difference of approximately 2 quadrats) or less should not be regarded as significant. |
>> Continue to Selected Heath Species Charts
Ecological Survey 2001 |