Wet Woodland Plant Survey
Survey Conclusions
continued

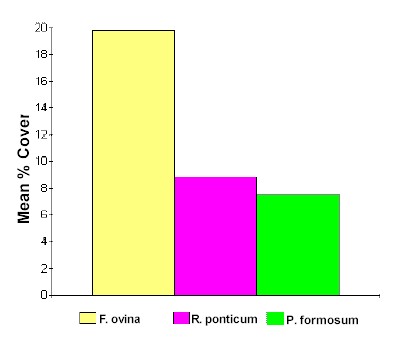
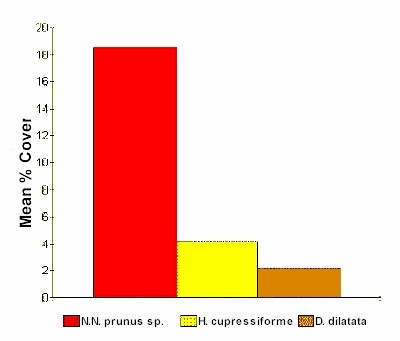
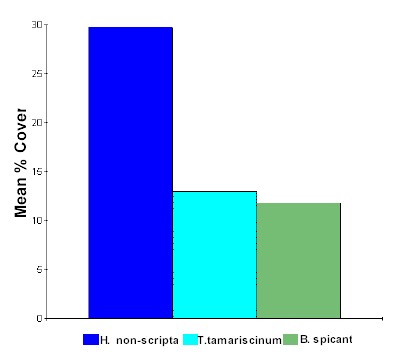
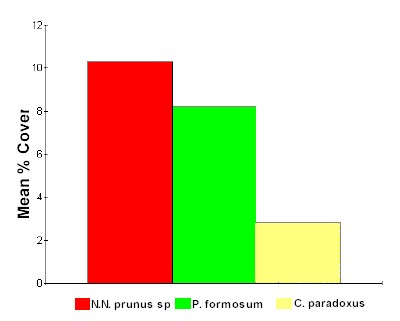
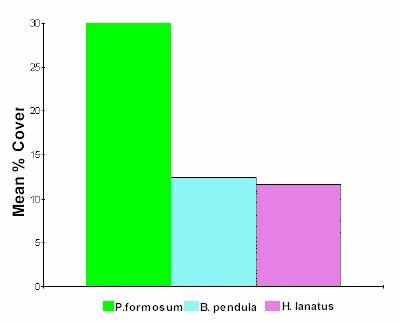
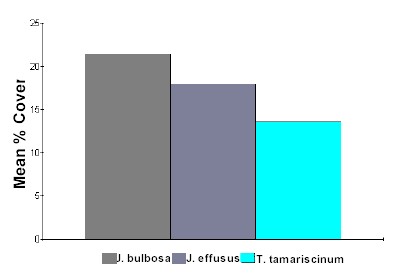
The following tables each display the three most dominant plant species in each named area
in terms of the greatest Mean % Cover.   Each species is colour coded.
Note that the vertical y-axes of the graphs are not all to the same scale.


mndgrph.jpg (14524 bytes)
The Mound

chrygrph.jpg (31674 bytes)
Cherry Area


blugrph.jpg (13766 bytes)
Bluebell Area


stnygrph.jpg (13558 bytes)
Stony Area


clrggrph.jpg (13176 bytes)
The Clearing


spgegrph.jpg (10760 bytes)
The Seepage


Continued


Back to Contents Page