 |
Offwell Weather Station Report |
 |
This page is updated every 10
minutes and displays the current weather conditions at the Woodland Education Centre.
Other pages include the 'Weather-at-a-Glance' and previous weather
records from the Offwell Weather Station.
Current
Weather Conditions
The data below is a detailed analysis of the current weather conditions
along with a brief explanation
of the terms used. For more detailed explanations of the terms used,
visit our weather glossary.
LATEST |
||
| Wind | Rain & Humidity | Temperature |
| Dew Point | Wind Chill | Temperature Perception |
| Heat Index | Air Density | Barometric Pressure |
Click here for
Weather at a Glance
|
|
|
|||
Average
wind speed (mph) during |
Wind
speed (mph) at listed time. |
Wind direction at listed time |
WIND CHILL & PERCEPTION OF TEMPERATURE
|
|
||
The
Temperature-Humidity-Wind |
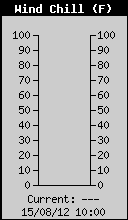
Wind Chill (C)
takes into |
|
|
|
|
||||
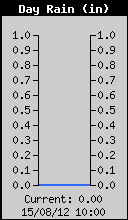
Total
rainfall (mm) during |
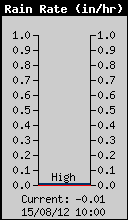
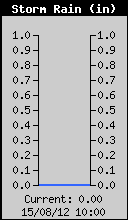
Variation
in rainfall rate |
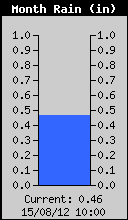
Total
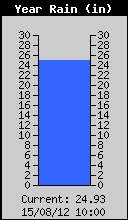
rainfall to date during |
Total amount of rainfall (mm) during the current calendar year. |
RAIN & HUMIDITY
|
|
||
|
Relative humidity
(%) is the |
TEMPERATURE, ATMOSPHERIC PRESSURE & DEW POINT
|
|
|
|||
Variation
in air temperature (C) |
Variation
in atmospheric pressure |
Dew-point (C) is
the |
|
|
||
The Heat Index
(C) uses the |
Air density
measures the |
Copyright © Offwell Woodland & Wildlife Trust 1998/9 & 2000/1/2/3/4/5
All the information including images, charts, movies and sounds is provided copyright free, only for educational use by schools, colleges and universities unless you are making a charge. If you wish to use information or any part of this site for commercial purposes or for any purpose where a charge is made then you must get permission, so make sure you contact us first. Remember, if you are not a school, college or university you must obtain permission to use any part of this website. Note that company logos are reproduced with permission and remain copyright of their respective owners.
